
In 2026, choosing ammonia is no longer just a question of price or availability. Buyers must compare production emissions, delivery routes, product specifications, and the reliability of supply. Grey ammonia remains widely available, while blue ammonia uses carbon capture and storage to reduce production emissions. Green ammonia is made with renewable electricity, but its cost and availability vary by region. The labels help, but they do not tell the whole story.
Details matter. A buyer reviewing a delivered-cost quote should check what it includes: production, storage, shipping, and handling at the destination. Emissions claims also need careful review, including the accounting method and the point in the supply chain being measured. Ask for current documentation, not just a color-coded label. Small differences in assumptions can change the comparison.
There is no universal winner. A fertilizer producer with established import facilities may value dependable volume, while a shipping company may focus on certified emissions data and fuel compatibility. Local infrastructure, contract flexibility, and long-term price exposure can shift the decision. And forecasts can be wrong. This guide compares ammonia types through the practical questions global buyers face in 2026, while recognizing that real-world supply conditions remain uneven.
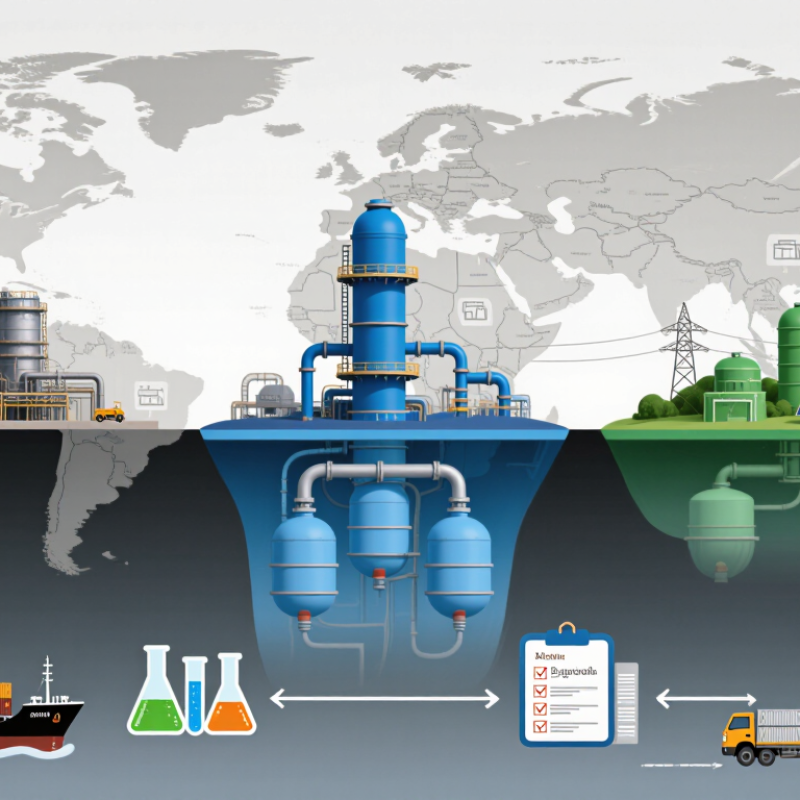
In 2026, ammonia’s color usually describes how it was produced, not its chemical grade. Grey ammonia is commonly made from natural gas or coal without carbon capture, so its production emissions can be substantial. Blue ammonia uses fossil-based hydrogen with carbon capture and storage. Its footprint depends on capture performance, energy use, and upstream methane emissions. Green ammonia uses hydrogen produced with renewable electricity and nitrogen from air. The label alone does not prove a low lifecycle footprint.
A color label can simplify too much. Buyers should request credible emissions data and check what the calculation includes. Electricity sources, capture rates, and transport can change the comparison. Green supply may also vary with renewable power availability. Details matter.
Physical product grades answer a different question: what is being delivered? Anhydrous ammonia contains very little water and is typically handled as a pressurized or refrigerated liquid. Aqueous ammonia is ammonia dissolved in water, with concentration specified for the intended use. Buyers should confirm concentration, purity limits, water content, and relevant contaminants against their process requirements. Storage temperature, tank materials, unloading equipment, and local handling procedures matter too. A technically suitable production route cannot compensate for the wrong concentration or an incompatible delivery setup. Procurement teams sometimes overlook this distinction. That is worth reconsidering.
Global ammonia buyers in 2026 face a choice shaped by both cost and carbon intensity. The IEA estimates that natural gas supplies about 70% of ammonia production worldwide. Producing ammonia releases roughly 450 million tonnes of CO₂ each year. That is a substantial footprint for a chemical used in fertilizers and industry.
Conventional, gas-based ammonia remains widely available, but its emissions make it a less attractive option for buyers with climate targets. Blue ammonia uses carbon capture to reduce some production emissions. Its actual footprint depends on capture rates and emissions from gas supply. Green ammonia is made using renewable electricity and can have much lower production emissions, though availability and cost remain important constraints. Labels are not enough.
Buyers should compare verified lifecycle emissions, not just the production method named in a sales document. Ask whether figures include upstream methane, electricity use, and transport. A shipment’s origin and production data matter. So does consistency across suppliers. I would not assume that a lower-carbon label tells the whole story; measurement boundaries can differ. It is an imperfect market, and some claims need closer scrutiny. For 2026 purchasing, clear emissions data can be as useful as price when weighing conventional, blue, and green supply.
A buyer-oriented comparison of major production pathways. Emissions and cost outcomes depend on plant design, energy sources, carbon capture, and supply-chain boundaries.
| Ammonia type | Typical production route | Indicative emissions profile | Supply and cost considerations | Buyer fit in 2026 | Key due-diligence questions |
|---|---|---|---|---|---|
| Conventional natural-gas ammonia (“grey”) | Natural gas supplies hydrogen through steam methane reforming or a related reforming process; nitrogen is separated from air; the gases are synthesized into ammonia. | Carbon-intensive. Natural gas is the feedstock for about 70% of global ammonia production, and ammonia production emits about 450 Mt of CO₂ per year, according to IEA estimates. | Uses established technology and existing infrastructure. Costs are strongly affected by regional natural-gas prices and availability. | Potentially suitable where near-term availability and established logistics are priorities and emissions requirements permit conventional supply. | Request plant-specific emissions data, the stated emissions boundary, energy-source details, and confirmation of the production route. |
| Conventional coal-based ammonia | Coal gasification produces hydrogen-containing synthesis gas; further processing removes impurities and supplies hydrogen for ammonia synthesis. | Generally more carbon-intensive than natural-gas-based production because coal conversion produces substantial CO₂. Coal is an important production feedstock, particularly in China. | Economics depend on local coal prices, plant efficiency, environmental controls, and access to transport and storage infrastructure. | May be available in some regional markets, but is usually a poor fit for buyers facing stringent emissions limits. | Check direct and indirect emissions, plant efficiency, pollution controls, and whether reported figures include upstream fuel impacts. |
| Natural-gas-based ammonia with carbon capture (“blue”) | Conventional gas-based production combined with capture and permanent storage or utilization of some process CO₂. | Can reduce emissions compared with unabated production, but the reduction varies with capture coverage, plant energy use, methane leakage, and CO₂ storage performance. | Requires capture, transport, and storage infrastructure. Added costs and project availability vary by location. | May suit buyers seeking lower-emissions supply before large volumes of renewable ammonia are available, provided reductions are independently verified. | Ask what share of total site emissions is captured, how residual emissions are counted, how methane leakage is treated, and how permanent storage is verified. |
| Renewable-electricity-based ammonia (“green”) | Water electrolysis powered by renewable electricity produces hydrogen; nitrogen is separated from air; both are used for ammonia synthesis. | Can have very low production emissions when electricity is genuinely renewable. Lifecycle emissions still depend on electricity sourcing, equipment, construction, and transport. | Requires substantial low-emissions electricity, electrolyser capacity, and suitable infrastructure. Cost and availability depend on renewable power and project scale. | Strong fit for buyers prioritizing deep production-emissions reductions, subject to credible certification, delivery reliability, and price requirements. | Verify electricity sourcing and time-matching rules, lifecycle accounting, additionality requirements where applicable, certification, and delivery arrangements. |
| Other low-emissions ammonia | May use low-emissions hydrogen from sources other than renewable electrolysis, or combine production routes with carbon capture and other emissions controls. | Not a single emissions category. Performance must be assessed against a clearly defined lifecycle boundary and verified project data. | Availability, cost, and infrastructure needs depend on the specific hydrogen source and production configuration. | Can be considered when the supplier demonstrates a robust, independently verified emissions profile that meets the buyer’s criteria. | Require transparent methodology, verified emissions intensity, energy-source disclosure, and documentation of any carbon capture or offset claims. |
Notes: The IEA figures shown here are global estimates, not a 2026 forecast or a guarantee for any individual plant. “Grey,” “blue,” and “green” are common market labels rather than universally standardized emissions thresholds. Compare suppliers using the same lifecycle boundary and units, typically tonnes of CO₂-equivalent per tonne of ammonia. Reference: International Energy Agency, Ammonia Technology Roadmap (2021).
Blue ammonia can offer lower lifecycle emissions than conventional ammonia, but the label alone proves little. Buyers should examine how much carbon dioxide is captured, where it comes from, and what happens to it afterward. A plant’s capture rate may cover one process stream while excluding emissions from fuel use. That gap matters.
Tips: Request emissions data per tonne of ammonia, with clear system boundaries and the calculation method. Check whether reported capture reflects measured operations or design expectations. Ask for independent verification and documentation of CO₂ transport and storage. Also examine methane leakage across gas production and delivery; small leaks can meaningfully weaken climate claims. Details matter.
Compare suppliers using the same lifecycle scope, including feedstock, plant energy, and transport to the delivery point. Look for dated, site-specific figures rather than broad averages. A verified result should explain its assumptions and uncertainty, not hide them behind a single attractive number. Some data may remain imperfect, especially across complex supply chains. Buyers should record those gaps and revisit them as better measurements become available.
Green ammonia can help buyers reduce supply-chain emissions, but its value depends on how it is made and delivered. Electrolysis splits water using electricity, so the power source matters: renewable supply should be traceable and available when production runs. A project using a cleaner annual average may still draw grid power at other hours. That detail can change its emissions profile.
Certification should document electricity sourcing, production emissions, and the chain of custody. Ask whether the certificate covers the specific shipment, not only the facility. Labels alone are not enough. Delivered cost also includes conversion, storage, port handling, freight, and any required conditioning. Compare these costs with realistic delivery schedules and product specifications. The comparison is rarely tidy; data quality and local infrastructure can shift the result.
Tips: Request hourly or otherwise transparent power data, shipment-level certification, and a full delivered-cost breakdown. Check port capacity and storage conditions early. Leave room for uncertainty: projected costs can look precise before the supply route is proven.
Green ammonia: compare renewable power, electrolysis, certification, and delivered cost
Indicative planning scenarios, not observed market quotes or forecasts. The model assumes 10.5 MWh of electricity per tonne of ammonia, with renewable power priced at $25, $45, and $70/MWh across the three scenarios. Other conversion and synthesis, certification, and logistics costs are scenario assumptions. Buyers should compare verified renewable-power sourcing, electrolyser performance, recognized certification, and route-specific delivery costs.
Global buyers should choose ammonia by measured carbon intensity, not color alone. “Blue” and “green” labels can hide different production routes and accounting boundaries. Ask for verified lifecycle emissions data, including feedstock, energy use, and transport. Evidence matters.
Then match the product to the process. Confirm concentration, water content, oil, and other impurity limits against the receiving plant’s specifications. A small quality mismatch can disrupt catalysts or create extra handling work. Check the certificate of analysis for each shipment, not only a sample from the sales stage. Details count.
Logistics may decide the purchase. Refrigerated cargoes need suitable terminals and storage; pressurized deliveries require compatible tanks and transfer equipment. Verify that unloading rates, vessel access, and seasonal schedules fit the site. Safety systems must also match the product’s properties and local operating procedures. No shortcut here.
Supply security deserves equal weight: compare production regions, routes, inventory cover, and backup volumes. A low-carbon option is less useful if one port delay stops operations.
I would avoid relying on a single “best” type; buyers should test the full chain, including emissions evidence and delivery resilience.
One imperfect point: supplier data may not use identical methods, so comparison can remain uncertain until boundaries are checked.
Accreditations
ISO 9001 Quality Management
HSE Management Compliant
Products and services comply with relevant Australian (AS) and international (ISO, etc.) Standards.
"*" indicates required fields